2021-2022
Records from April 2021 to April 2022.
Aggregation
| Number of photos taken per year | 18,526 |
| _of retouches | 1,558 |
| _of HP Listings | 173 |
2021-2022. Aggregation
Daily Average
| Number of photos taken per year | 50.76 |
| _of retouches | 4.27 |
| _of HP Listings | 0.47 |
Daily Average
Number of Posts by Theme
| Portrait | 94 | 54.02% |
| Action | 23 | 13.22% |
| Landscape | 52 | 29.89% |
| Detail | 3 | 1.72% |
| Abstract | 2 | 1.15% |
Only as posted on our website.
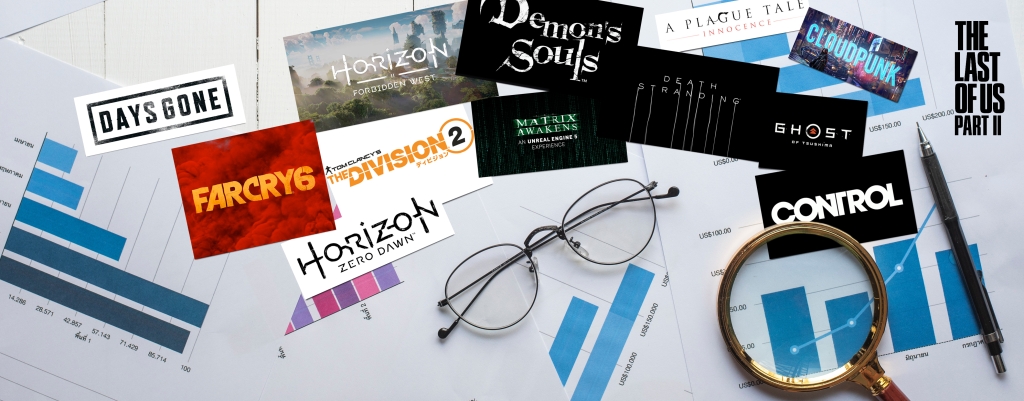
Number of Shots by Title
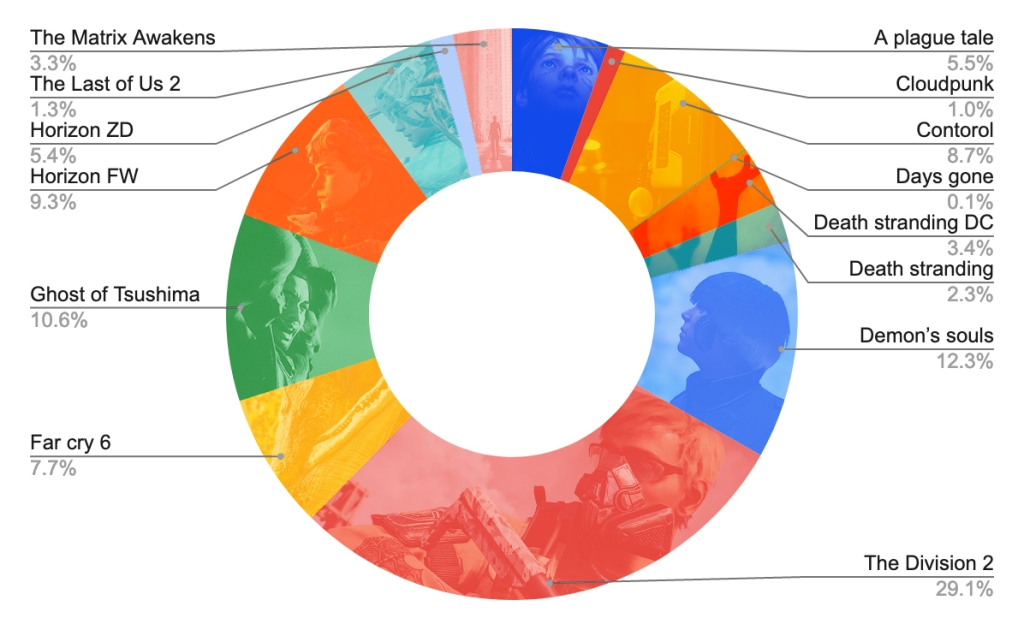 Percentage of shots by title
| title | num | proportion |
|---|
| A plague tale | 1016 | 5.48% |
| Cloudpunk | 187 | 1.01% |
| Control | 1610 | 8.69% |
| Days gone | 12 | 0.06% |
| Death stranding DC | 633 | 3.42% |
| Death stranding | 417 | 2.25% |
| Demon’s souls | 2277 | 12.29% |
| The Division 2 | 5400 | 29.15% |
| Far cry 6 | 1431 | 7.72% |
| Ghost of Tsushima | 1963 | 10.60% |
| Horizon FW | 1716 | 9.26% |
| Horizon ZD | 1007 | 5.44% |
| The Last of Us 2 | 242 | 1.31% |
| The Matrix Awakens | 615 | 3.32% |
2021-2022. Number of shots by title